Account Receivable Dashboard: Benefits, Examples and Tips
The dashboard for accounts receivables gives you an overview of all the important AR data your company needs to monitor.
It keeps you informed about customers who have fallen behind on payments, money trapped in various aging buckets, days sales outstanding (DSO), and collector effectiveness index (CEI).
A business’s cash flow is its accounts receivable. By letting you know which clients owe you money and how much, it helps you manage your cash flow.
You may determine whether your cash account truly reflects your current financial situation in this way.
In other words, it can mean the difference between relaxing in the assurance that you have enough money or fretting that you don’t.
What is An Account Receivable?
The money a company expects to receive from selling its products or services from its clients is referred to in finance as accounts receivable.
It represents the sum of money you have sent invoices but have not yet received payment.
When you get paid for an invoice, you should credit your cash account and debit your accounts receivable for that sum.
The AR of your company is an important KPI for determining your profitability & cash flow thus it serves as the most accurate measure of your revenue.
It is seen as an asset because it symbolizes incoming funds for the business.
Profitability is calculated by adding up all of your assets, including accounts receivable, and deducting it from all your liabilities, which are the sum of your debts to suppliers and vendors.
If the number is in plus, the business is profitable. You’ll need to decide whether to increase assets or decrease liability if the figure is negative.
What Is An Account Receivable Dashboard?
An account receivable dashboard is a visually arranged KPI; used to manage, examine, and keep track of accounts receivable activities.
It gives team members an easy-to-understand summary of all A/R activities in one location.
Your transaction systems like billing or ERP are the basic source of the Account Receivable dashboard. This offers further information about trends in consumer behavior and payment methods.
It also enables the A/R team to respond quickly and decisively to client issues and late payments.
When looking for accounts receivable software with a dashboard, it must be able to drill down into these crucial performance areas:
- Current AR Aging Reports
- Invoice management
- Average days to pay
- A cash flow
- Top delinquent accounts
- Summary of payment collection activities
- Summary of customer payments
- Projected cash receipts
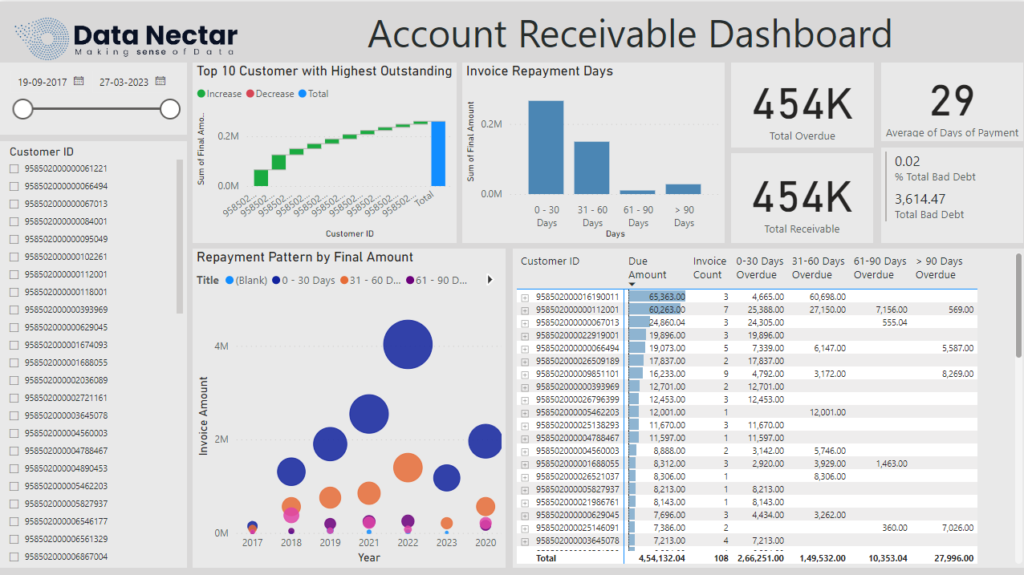
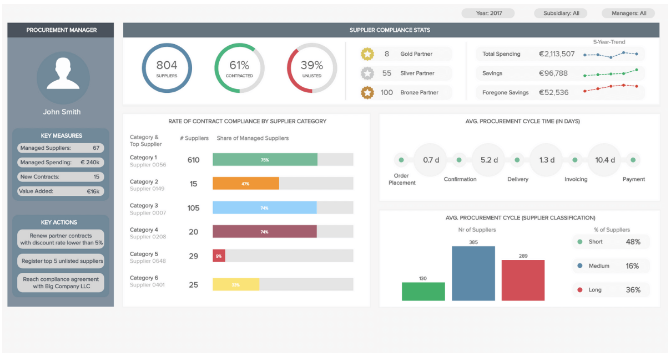
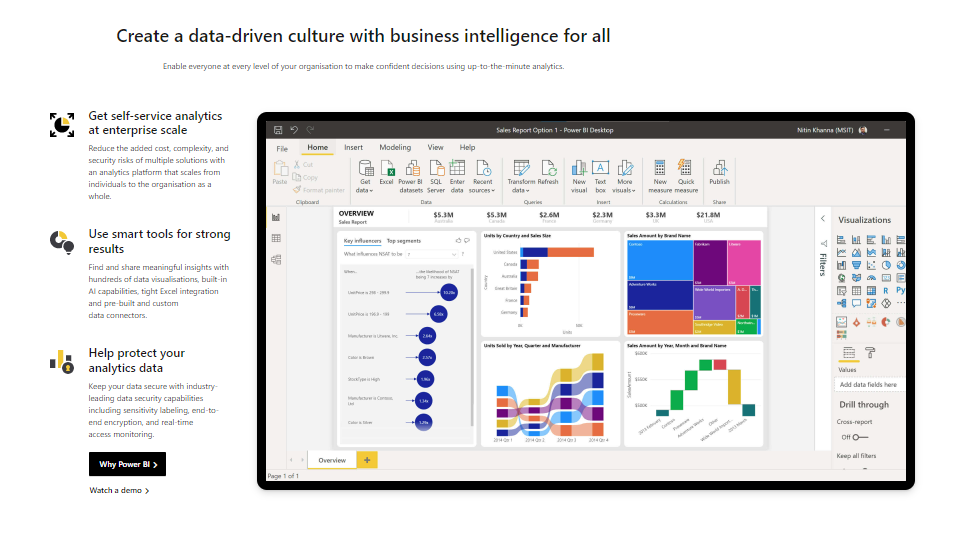
Account Receivable Dashboard Example – Power BI
Why Keep Track Of Accounts Receivables?
You might forget to bill some clients, or you might not be aware of whether you have been paid if you don’t maintain track of your accounts receivable.
Your business may suffer if you decide to offer your product for free. The chance that you will obtain money quickly decreases as you delay sending an invoice.
Another excellent technique to provide evidence of income for tax purposes is maintaining track of accounts receivable.
Accounts Receivable (AR) Dashboard Benefits
A graphical tool that supports firms in tracking and managing their receivables is the account receivable dashboard benefits.
A real-time view of receivables, sales progress, and Days of Sales Outstanding is provided via the accounts receivable (AR) dashboard.
It also provides the option to focus on particular invoice management and clients. Below are some benefits of the AR dashboard.
1. Real-Time Updates
Without automation, businesses can put off performing new KPI calculations for weeks or even months. The A/R team may give managers access to these figures monthly or quarterly.
This may sound routine enough, but you need up-to-date financial information to identify possible issues before they become serious.
2. Accurate Information
Thanks to dashboard benefits, the team can maintain accuracy and stay current on all accounts receivable data.
Real-time updates relieve workers of the burden of managing manual report generation and spreadsheets cluttered with mistakes.
3. Granular Insights
Data can be divided into more manageable portions using the benefits of the AR dashboard. This can be used to spot trends, patterns, and problem areas.
To better understand their team’s success, managers can compare the various measures.
4. Improved Performance
Managers can use the A/R dashboard’s real-time data to reorder jobs or change tactics instantly. The metrics can assist managers in quickly identifying and addressing changes in consumer behavior.
This can reduce time spent on activities that don’t provide value and boost productivity.
5. Team Motivation
A dashboard is a fantastic tool for revealing team and individual achievement information.
It makes it possible to acknowledge exceptional achievement and contributes to developing a competitive environment.
The motivation of the team may also increase by eliminating manual calculations.
6. Improved Cash Management
Overall, the cash conversions and expenditures are made better thanks to the AR dashboard benefits.
Managers can identify slow-paying clients, focus their collection operations, and decide more wisely when to extend payment terms or take other actions.
Who can utilize an AR Dashboard for Accounts Receivable?
Businesses that sell on credit need to maintain or monitor the accounts Receivable (AR) dashboard to track and manage client payments and unpaid balances.
A business’s following departments or teams may specifically employ an AR dashboard:
- Accounts Receivable Department
- Finance Department
- Sales Department
- Executive Leadership
An accounts receivable (AR) dashboard can be used by any employee of a company who is in charge of overseeing customer payments, cash flow, or general financial health.
An AR dashboard may assist organizations in enhancing their collection performance, lowering delinquencies, and ensuring they have the cash flow required for success by giving real-time visibility into important indicators and trends.
What Are Account Receivable KPIs to Monitor?
Businesses use an accounts receivable (AR) dashboard to track and manage client payments and unpaid balances.
Examples of AR dashboard metrics that organizations can use to monitor their cash flow and collections AR dashboard examples are provided below:
1. Outstanding Balances
This measure displays the overall amount of past-due or unpaid customer debt. It enables companies to order their collection efforts according to customers or invoices.
2. Days Sales Outstanding (DSO)
This indicator calculates the typical time it takes for a company to receive money from its clients.
A high DSO suggests the company is overly slow in collecting payments, which can harm cash flow.
3. Collection Efforts
This metric displays how many client payment collection calls, emails, or letters have been made.
Additionally, it can demonstrate how effective these efforts were by displaying the proportion of late sums that have been collected.
4. Invoice Outstanding Aging
This statistic defines unpaid sums according to the length of the duty, such as 30 days, 60 days, or 90 days or more.
It assists companies in determining which clients are behind on their payments and may call for more eager collection operations.
5. Cash Flow Forecast
This measure displays the anticipated cash flows for a given time frame, such as the following month or quarter.
It enables companies to prepare for cash shortages and anticipate changes to their accounts receivable collection operations.
These KPIs can be changed to meet the company’s unique requirements and displayed on an AR dashboard in various visualizations, such as graphs, tables, or charts.

Tips For AR Dashboard
Here are some useful tips for an AR dashboard that enables you to monitor the efficiency of your collections, enhance your cash flow, and guarantee the financial stability of your company.
Following are a few tips for AR Dashboard designing a successful Accounts Receivable (AR) dashboard:
1. Identify Key Performance Indicators
Decide which metrics, such as unpaid balances, DSO, collection efforts, customer aging, and cash flow prediction, are crucial for your company to keep updated on.
Concentrate on the indicators that will most impact your attempts to increase collections and cash flow.
2. Use Visualizations
Use visualizations like charts, graphs, and tables to display the data in a clear and easy way to understand.
Select data visualizations that can be modified to meet your company’s needs and that draw attention to patterns and outliers in the data.
3. Set Goals and Targets
For each indicator, set specific objectives and track your progress over time toward reaching them.
This will enable you to pinpoint areas that need more care and concentration and confirm that you are moving forward with enhancing the performance of your collections.
4. Provide Context
Include details like historical trends, industry benchmarks, and comparable data to give the data perspective.
This will show you how your company is doing compared to others in the same industry and point out any areas where you can improve.
5. Monitor Regularly
Regularly check your AR dashboard, and alter your collections plan as necessary.
Utilize the benefits of the AR dashboard to spot data trends and patterns and proactively deal with problems before they grow into bigger ones.
6. Automate Data Collection
Use technology to automate data collecting and reporting, such as accounting software. You’ll save time and ensure the accuracy and timeliness of the data by doing this.
What is The Difference Between Accounts Receivable & Accounts Payable
A company’s financial administration includes two distinct but equally significant components: accounts payable (AP) and accounts receivable (AR).
1. Account Receivable
Money due to a company by its clients for products or services that have been provided or rendered but have not yet been paid for is called accounts receivable.
AR is the amount of money that the company projects its clients will provide in the future. The consumer receives an invoice from the firm for the amount owed and must make payment within a certain amount of time.
2. Accounts payable
It describes the sum of money the company owes its vendors or suppliers for services or products that have already been received but are still not compensated for.
Account Payable is the sum of money the company must eventually pay its suppliers or vendors.
The supplier or vendor sends the firm an invoice for the sum due, and the business must pay the invoice within a certain amount of time.
Why Choose DataNectar?
Businesses must pick the best A/R software solution to maximize the use of their A/R dashboards. Companies should choose the most important specifications for managing finances and business operations.
It should verify compatibility with both existing and upcoming software and relevant infrastructure. Finally, pick a reputable software provider that offers top-notch support.
Our automation solution at DataNectar has produced outstanding results for our clients. They have decreased DSO and at-risk receivables with our assistance.
Additionally, our customers have experienced fewer past-due invoices and quick cash payments. Contact DataNectar for more information.